
Leak 2: The “Abandoned Cart” – The Heartbreaker
This leak is pure, measurable lost revenue.
A visitor has shown high intent—they’ve selected products and started checkout—only to vanish at the last second.
This often happens due to unexpected friction at the final hurdle, such as:
- A surprise shipping cost or fee added at checkout.
- A complicated, multi-step process that asks for too much information.
- A lack of trusted, local payment options (like Ozow or SnapScan) that make customers hesitant.
Leak 3: The “Silent Drop-Off” – The Mystery in the Middle
This is the trickiest leak to spot without data.
A visitor browses several pages, seems engaged, and then simply disappears without reaching your “Contact Us” or “Buy Now” goal.
They’re getting lost or hitting an unseen roadblock in the middle of their journey, like:
- Not finding enough information to make a decision.
- Getting confused by your website’s navigation.
- A key button (like “Request a Quote”) that is broken or hard to find.
The first step to plugging these leaks is accepting that they exist.
Next, we’ll use Google Analytics 4 to find the exact pages and steps where these profit-draining exits are happening.
Your Digital Torch: Using GA4 to Shine Light on the Problems
Now you know what to look for—the “Bounces,” “Abandoned Carts,” and “Silent Drop-offs.”
But to fix these leaks, you need to know exactly where they’re happening.
This is where Google Analytics 4 (GA4) becomes your digital torch, shining a powerful light on the problems so you can plug them for good.
You don’t need to be a tech wizard to use these tools; you just need to know where to look.
Finding Instant Exits: The Pages & Screens Report
A high bounce rate is your most urgent warning signal.
To identify your worst-offending pages, start with the Pages and screens report:
Reports > Engagement > Pages and screens.
This report shows you exactly which pages users are landing on and how many leave immediately.
Look for pages with a high number of “Views” but a very low “Average engagement time”—these are your prime suspects.
For a local South African business, this could be a landing page for a Facebook ad promoting a new product.
If the bounce rate is sky-high, the page likely isn’t matching what the ad promised or is failing to grab attention instantly.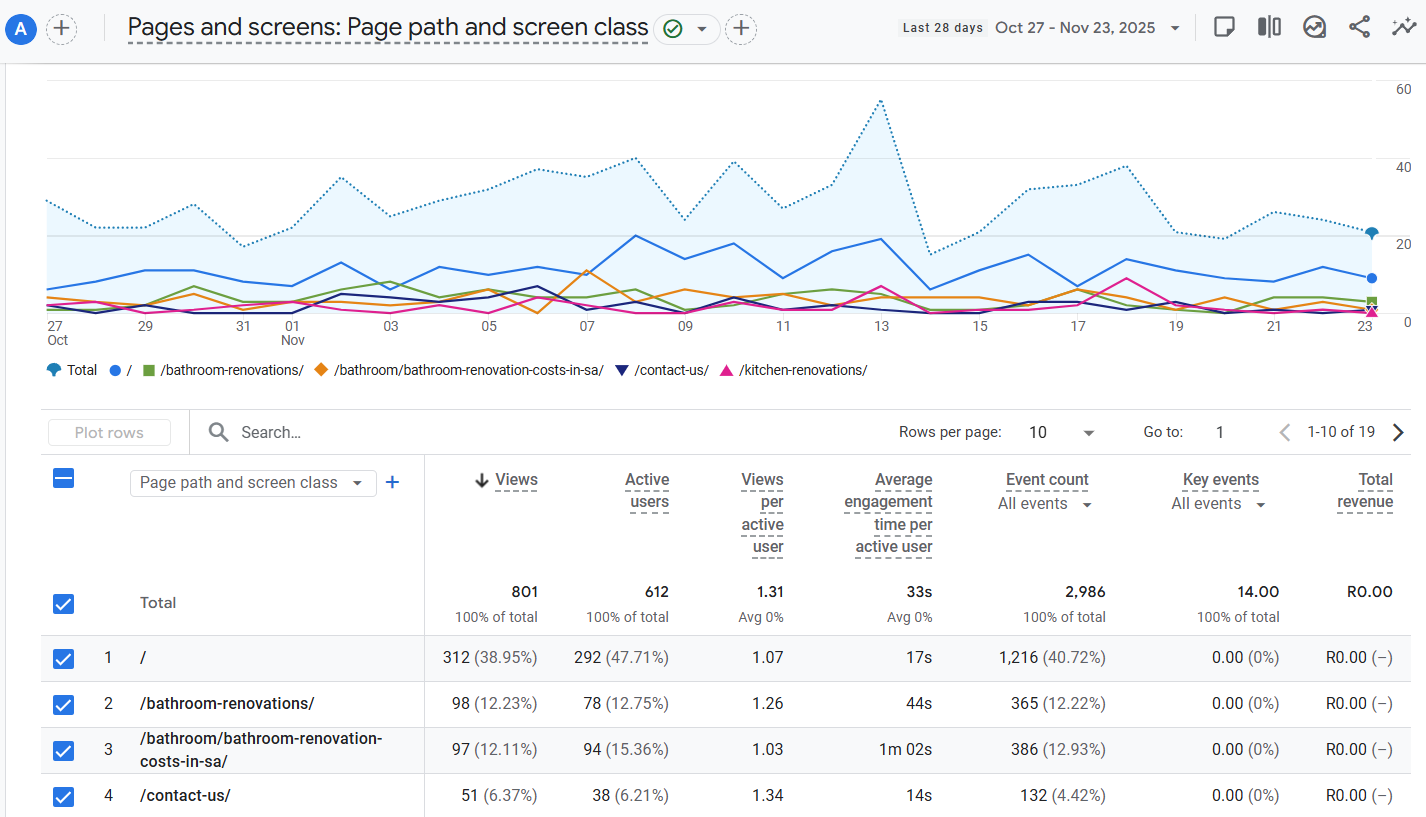
Mapping the Customer Journey: The Funnel Exploration Report
To investigate “Abandoned Carts” and “Silent Drop-offs,” you need to see the complete customer journey.
GA4’s Funnel Exploration report is your most powerful tool for this.
You’ll find it under the “Explore” section on the left menu.
Here, you can map out the exact steps you want a customer to take, such as viewing a product, adding it to the cart, beginning checkout, and completing a purchase.
The visual report will show you, step-by-step, the percentage of users who drop off at each stage.
If you see a massive drop between “add to cart” and “begin checkout,” you’ve found your exact leak.
This data stops you from guessing and tells you precisely where to focus your energy.
Identifying Mystery Exits: The ‘Next Action’ Analysis
Sometimes, users disappear without a clear reason.
The Funnel Exploration has another trick: the ‘Next Action’ analysis.
After a user completes a step (like viewing a product), this feature shows you what they did next.
Did they go to your “About Us” page?
Did they leave the site?
Or did they get stuck because the “Add to Cart” button was broken?
This insight helps you understand the confusing paths or dead ends that are costing you sales.
Digging Deeper: Why Are They Leaving? (Hypothesising the “Why”)
Now that GA4 has shown you where customers are leaving, it’s time to play detective and figure out why.
The data gives you the clues, but your business sense provides the motive.
Don’t just look at the drop-off percentages—ask what they mean for a customer’s experience.
Hypothesis for a High Bounce Rate Page
If your Funnel Exploration or Pages report shows visitors are leaving a key page in seconds, it’s likely a mismatch or a poor first impression.
Ask yourself:
- The Promise Gap: Does your Facebook ad or Google Ad promise “Free Delivery,” but the landing page buries that information?
- The Slow Load: Is the page, especially the image or video at the top, slow to load on a mobile phone? South Africa’s variable mobile networks make this a critical check.
- The Cluttered Hook: Is the headline unclear? Are there too many pop-ups or buttons before the visitor can even understand what you offer?
Hypothesis for Cart Abandonment
A major drop-off at checkout is almost always caused by unexpected friction or doubt.
Your hypothesis should focus on the final hurdle:
- Sticker Shock: Was the total cost, including shipping, tax, or currency conversion, only shown at the very last step?
- Trust Deficit: Did the checkout page lack clear trust signals, like security badges (SSL), certified payment logos, or a simple returns policy?
- Process Fatigue: Did you force them to create an account before buying, instead of offering a simple “Guest Checkout” option?

Hypothesis for a Mid-Journey Drop-Off
When users vanish after browsing a few pages, they’re likely engaged but unconvinced.
The “Next Action” analysis in your funnel can hint at the problem:
- Information Black Hole: Did they hit a product page with poor photos, sparse descriptions, or no customer reviews?
- Confusing Navigation: Could they not find the “Pricing” or “Contact” page easily from where they were?
- Weak Call-to-Action: Was the next step (like “Add to Cart” or “Book a Consultation”) visually hidden or passively worded?
Forming these hypotheses turns raw data into an action plan.
You Might Also Enjoy: Finding Your Target Audience: The ‘Sniper Focus’ Marketing Strategy
Each “why” points directly to a fix you can test, which we’ll cover in the final section.
Fix 2: For Cart & Checkout Abandonment
A leaky checkout process needs friction removed and trust reinforced at the final hurdle.
- Show All Costs Upfront: Display the full price, including estimated shipping, tax (VAT), and any fees on the product page or early in the cart—not as a last-minute surprise.
- Offer Guest Checkout & Trusted Payments: Never force an account creation. Offer popular, trusted local payment options like Ozow, SnapScan, or PayJustNow alongside credit cards.
- Add Security Assurance: Place security badges (SSL certificates), payment provider logos, and a link to your refund policy directly next to the “Pay Now” button.

Fix 3: For Mid-Journey Drop-offs
When users vanish while browsing, they need more convincing information and clearer guidance.
- Enrich Product Pages: Add multiple high-quality images, detailed specifications, and genuine customer reviews or testimonials.
- Clarify Navigation & Calls-to-Action: Use clear, descriptive menu labels like “Our Services” and “Pricing.” Make buttons high-contrast and use action-oriented text like “Add to Cart” or “Call for Pricing.”
- Address Objections Preemptively: Add a simple FAQ section on key pages to answer common questions about quality, delivery timelines, or installation.
Remember, data from Google Analytics 4 and Google Tag Manager tells you if a fix is working.
Implement one change, wait for a week of data, and compare the metrics.
This methodical, data-driven approach ensures you’re not just making changes, but making profitable improvements that directly stop your website from leaking money.
Conclusion
You no longer have to guess why your marketing isn’t converting.
By using Google Analytics 4 as your diagnostic tool, you’ve learned how to find the exact pages where profit drains away.
Google Tag Manager then gives you the precision to understand the specific actions—or inactions—causing those leaks.
For any South African SME, this process is transformative.
It turns your website from a frustrating cost centre into a tuned, profit-generating asset.
You stop pouring money into a leaky bucket and start investing in a powerful growth engine.
The power is no longer in the hands of web developers or vague feelings; it’s in the clear data you now know how to read and act upon.
Ready to stop the leaks for good?
Take the first step now: open your GA4 property and run a Funnel Exploration report on your main customer journey.
Your biggest opportunity for growth is waiting to be found.