If you’ve ever opened Google Analytics 4 and felt your eyes glaze over, this is for you.
Let’s be honest: you’re a business owner, not a data scientist.
Your time is for serving customers and chasing growth, not decoding a complicated tech tool.
You’ve likely heard you need GA4 to succeed, but no one has shown you the business value—the part that actually helps South African SMEs like yours make more money.
It’s enough to make you want to say voetsek to the whole thing!
Well, relax.
We’re going to ignore 95% of GA4 and focus only on the five reports that answer the critical questions you already have.
Consider this your no-nonsense guide to making GA4 work for you.
Where Your Customers Come From?
Let’s start with the most fundamental business question: is your marketing money being well spent?
You’re likely juggling Facebook ads, Google searches, Instagram posts, and maybe even a newsletter.
But which one is actually filling your shop? The Traffic Acquisition report in Google Analytics 4 is your answer.
It’s like having a friendly teller at the door who notes down whether each customer arrived by car, taxi, or on foot.
1. The Traffic Acquisition Report: How to Find and Understand Your Traffic Sources in GA4
Finding this report is simple. In your GA4 dashboard, look to the left-hand menu. Click on “Reports” > “Acquisition” > “Traffic acquisition.”
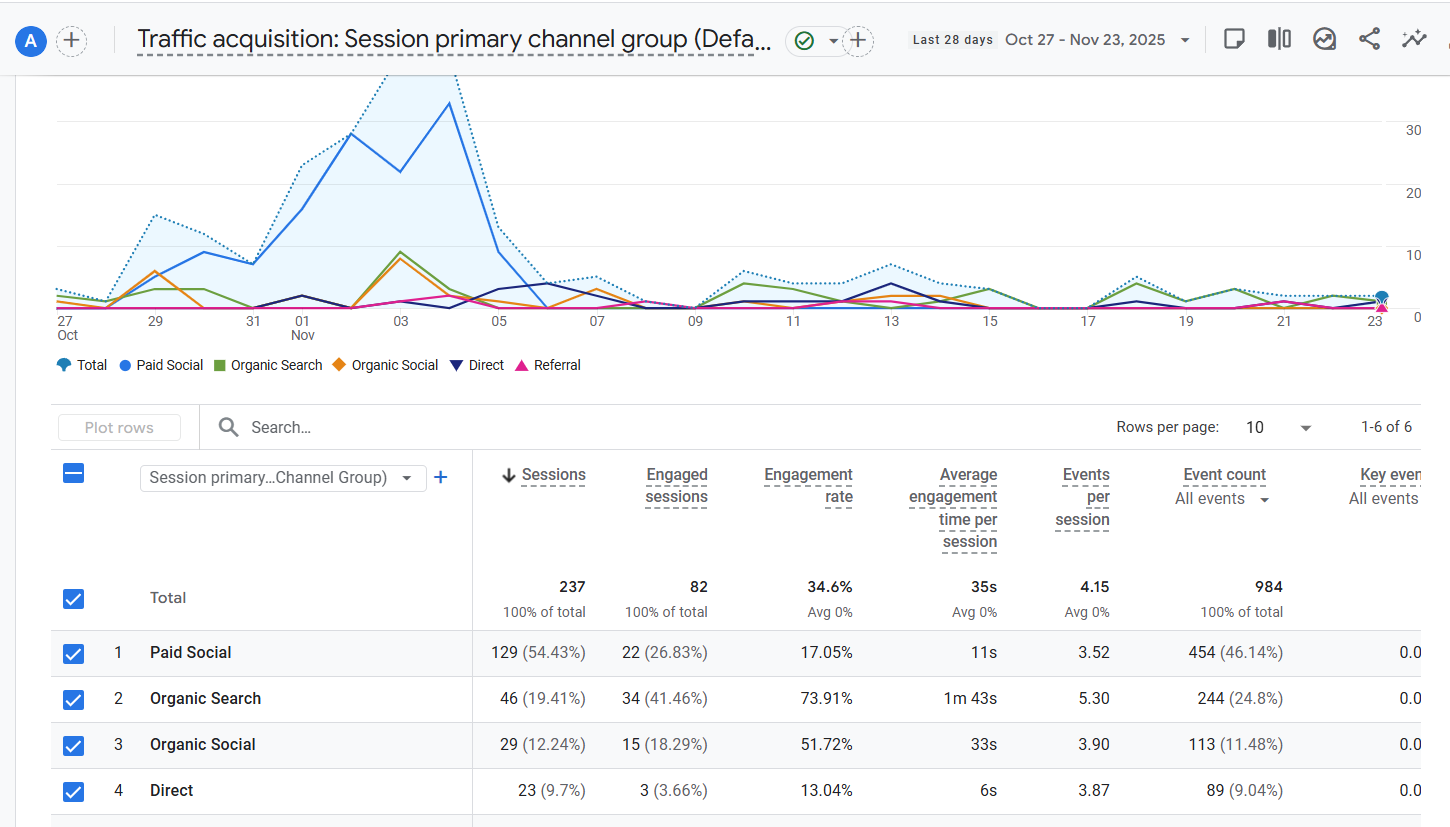
Don’t be alarmed by the table that pops up; we’re only going to look at the most important parts.
The “Session default channel group” column is what tells you the origin story of your visitors. You’ll see crucial categories like:
- Organic Search: People who found you by typing a query into Google. This is your foundation.
- Paid Search: Visitors who clicked on your Google Ads.
- Social: Traffic from platforms like Facebook, Instagram, and LinkedIn.
- Direct: Users who typed your website address directly into their browser—your brand loyalists.
- Email: Traffic from your newsletter campaigns.
For a South African SME like yours, this report is your marketing compass.
Imagine you’re a Cape Town-based bakery.
If you see you’re getting a massive chunk of your traffic from “Organic Search” for terms like “best koeksisters near me,” but very little from your paid “Social” ads, it’s a clear signal.
Your time and money are better spent optimising your website for local SEO and perhaps creating more local content, rather than pouring cash into social ads that aren’t yielding a return.
This report stops the guesswork and shows you where to plant your next marketing seeds for the best harvest.
2. The Pages and Screens Report: What Content Engages Your Audience
You know customers are visiting your website, but are they truly engaged, or just passing through?
The Pages and Screens report in Google Analytics 4 is your window into what captures their attention.
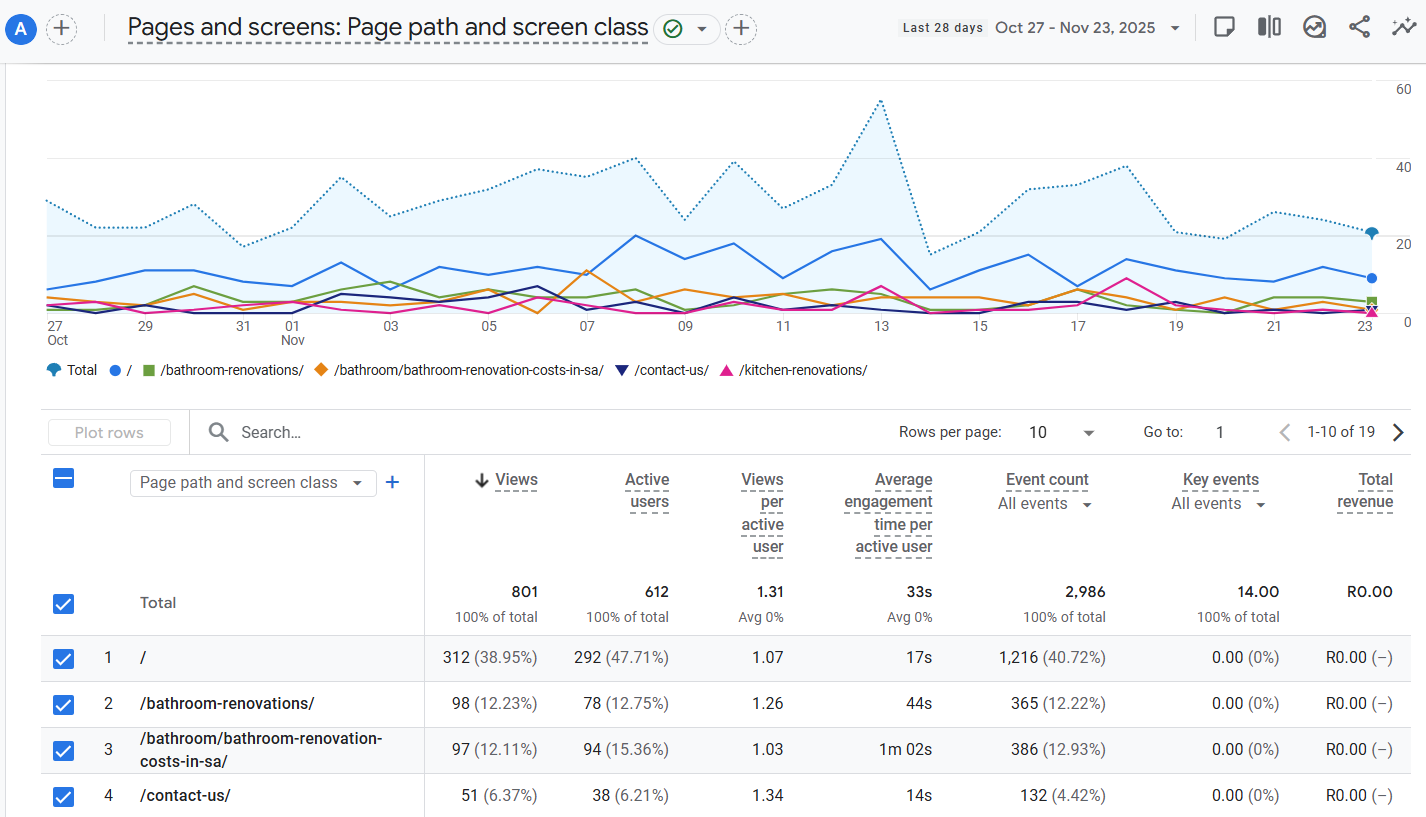
Think of it as a digital version of watching which products in your physical store people pick up, examine, and spend time with.
This insight is pure gold for South African SMEs looking to refine their content strategy and keep visitors hooked.
How to Access Your Engagement Data
Navigating to this report is straightforward.
In your GA4 property, head to “Reports” > “Engagement” > “Pages and screens.”
You’ll be presented with a list of your website’s URLs alongside key metrics.
Don’t feel overwhelmed by the data; for now, we’ll focus on the two most important columns for a business owner:
Views and Average engagement time.
What Your Top Pages Are Telling You
The data here tells a clear story about your customer’s interests.
A page with a high number of views and a long average engagement time is a winner.
For example, if you run a biltong subscription service and see your blog post “The Best Cuts for Homemade Biltong” consistently at the top of this report, your audience is sending you a direct message.
They’re not just browsing; they are deeply interested in the art of making biltong.
Turning Insights into Action for Your SA Business
This is where you move from data to decision.
That popular biltong blog post is a clear signal to create more related content.
You could film a video tutorial, create a downloadable spice rub guide, or even bundle the specific cuts of meat mentioned in the post into a special offer.
Conversely, if your key “Services” page has a high bounce rate, it indicates the page isn’t resonating and needs a rewrite.
By focusing on what already works, you can create more of the content that builds loyalty and drives sales for your local business.
You might also be interested in: Is Your Website Leaking Sales? Plug the Holes with Google Analytics 4
3. The Events Report: Your First Look at What Customers Actually Do
So far, we’ve seen where customers come from and what pages they view.
But as a South African SME owner, you need to know: what actions are they taking that actually move your business forward?
The Events report in Google Analytics 4 answers this question by showing you every important interaction customers have with your site.
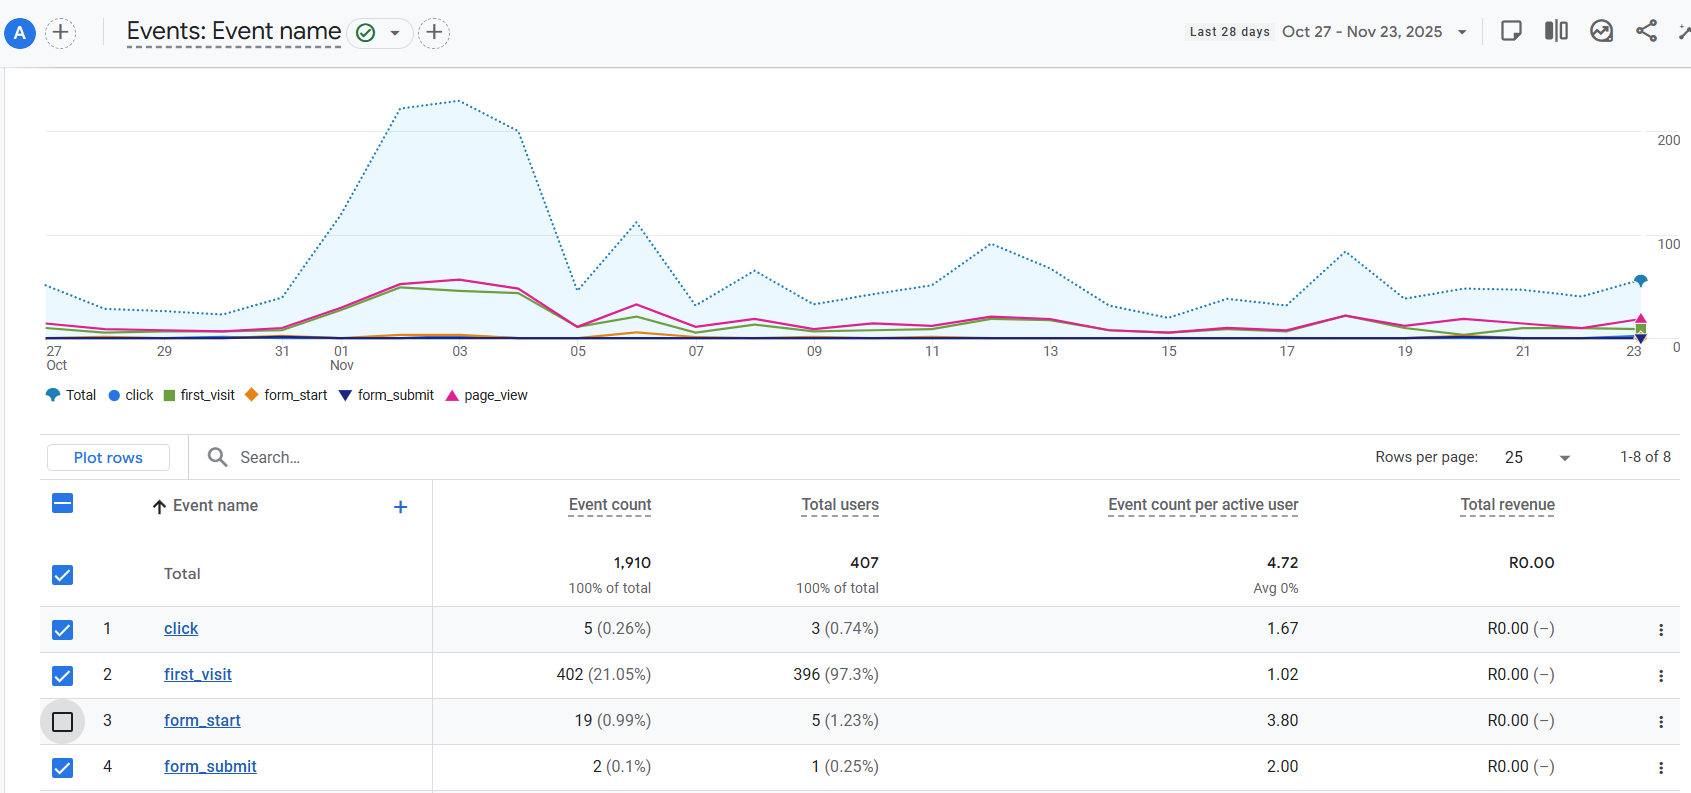
Think of this report as your website’s activity log.
While it might seem overwhelming at first glance, you don’t need to understand every single item.
For now, let’s focus on three automatic events that give you immediate insights without any technical setup.
The Top 3 Automatic Events to Watch
1. Form Submission: Capture Your Most Valuable Leads
When someone submits a “Contact Us,” “Get a Quote,” or any other form on your website, this action is automatically tracked in GA4.
For South African SMEs, this is pure gold – it represents a direct lead where a potential customer has actively raised their hand and shown serious interest in what you offer.
Monitoring which forms get the most submissions helps you understand what offers or contact points are most effective with your audience.
2. file_download: Track Your Most Valuable Content
When someone downloads your price list, brochure, or catalog, GA4 automatically records this as a file_download event.
This is crucial for South African SMEs because it shows high customer intent – someone downloading your price list is much closer to making a purchase than a casual browser.
Monitor which documents get downloaded most to understand what information your customers find most valuable.
3. scroll: Measure Real Engagement
The scroll event automatically triggers when users reach the bottom 90% of your pages.
This tells you whether people are actually reading your content or losing interest partway through.
If your key service page shows lots of views but low scroll rates, it might mean your introduction isn’t compelling enough to keep readers engaged.
How to Use This Information
You can find these events by going to Reports > Engagement > Events in your GA4 dashboard.
Start by reviewing these three events weekly – they’ll show you what content resonates with your audience and where you might need to make improvements.
This foundational understanding puts you in the perfect position to later track more specific actions that matter to your business.
By focusing on these built-in events, you’re taking the first crucial step from simply watching traffic numbers to understanding customer behaviour that actually impacts your South African SME’s growth.
4. The Tech and Demographics Reports: Who Your Audience Really Is
Knowing where your visitors come from and what they do on your site is crucial, but do you know who they actually are?
The Tech and Demographics reports in Google Analytics 4 answer this by painting a clear picture of your audience’s characteristics and how they access your site.
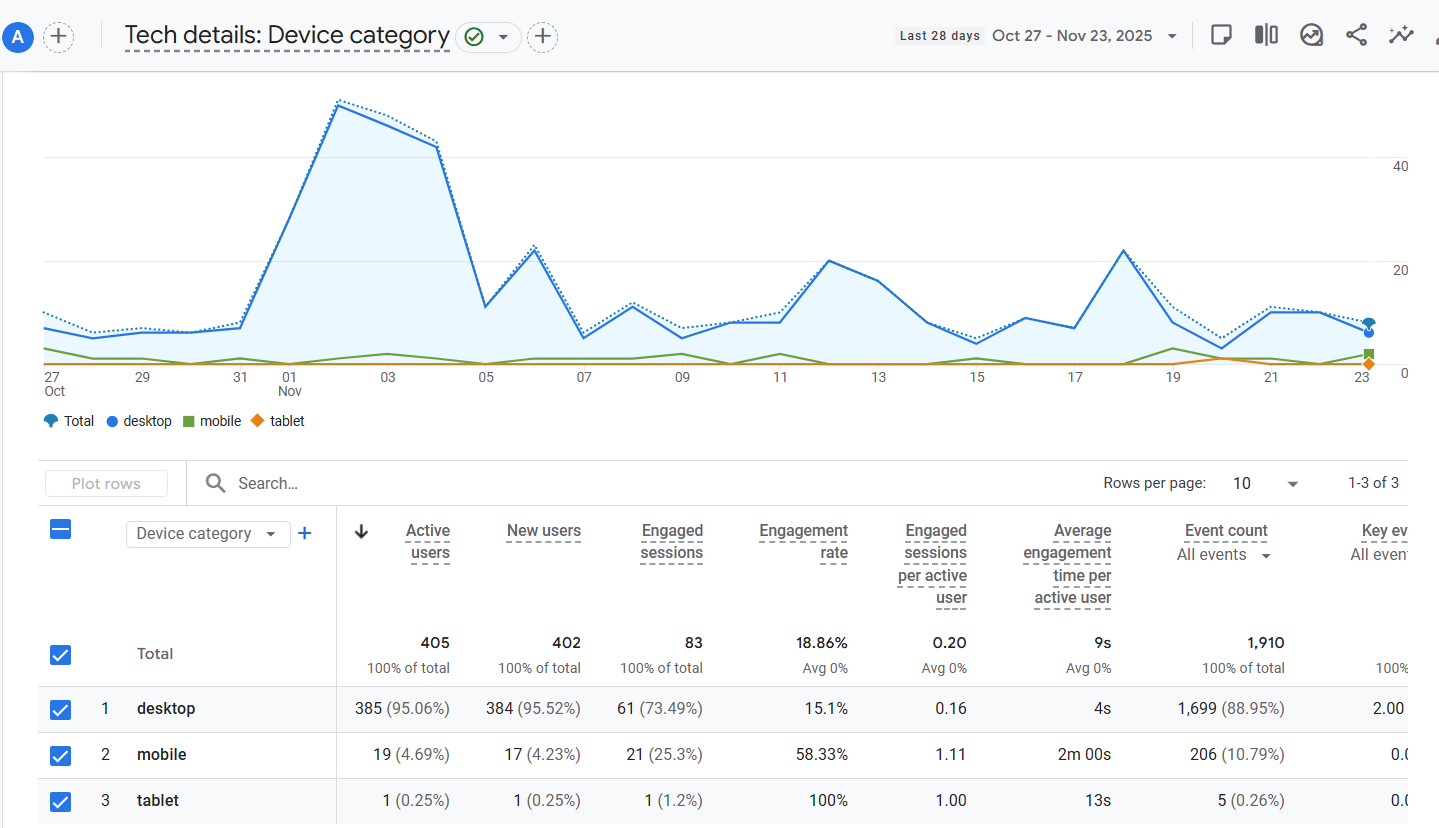
For South African SMEs, this is like getting to know your best customers on a first-name basis, allowing you to tailor your entire online experience to fit them perfectly.
Understanding the “Tech Details” Report: Are You Mobile-Friendly?
You’ll find this under “Reports” > “Tech” > “Tech details.” The most critical piece of information here is the breakdown under “Device Category.”
This shows you the split between desktop, mobile, and tablet users.
In South Africa, where smartphone usage is dominant, this report is non-negotiable.
If you discover that 70% of your traffic is on mobile, but your website is slow or difficult to navigate on a phone, you have a major problem that is directly costing you customers and conversions.
This report provides the hard evidence you need to prioritise a mobile-first website design.
Leveraging the “Demographic Details” Report
Located at “Reports” > “User” > “Demographic details,” this section reveals your audience’s geographic location.
For a local business, this is invaluable.
Imagine you’re a Pretoria-based catering company.
If this report shows significant traffic coming from Johannesburg, it’s a clear signal of unmet demand.
This insight could inspire a targeted Facebook ad campaign in Jo’burg or a review of your delivery radius.
Understanding your users’ locations ensures your marketing efforts are focused on the areas with the highest potential return.
Turning Audience Insights into Action
Together, these reports move you beyond one-size-fits-all marketing.
They answer critical questions: Should you invest more in mobile advertising? Is your website frustrating your primary audience? Are you overlooking a potential market in a nearby city?
By aligning your website and marketing strategy with the reality of who your customers are and how they access your site, you create a more effective, efficient, and profitable online presence for your South African business.
5. The Realtime Report: See Your GA4 Data Live
After looking at reports that show you historical data, let’s explore one of the most exciting features in Google Analytics 4 – the ability to see what’s happening on your website right now.
The Realtime report is like having a security camera feed for your digital storefront, showing you live customer activity as it happens.
For South African SMEs, this provides immediate feedback and a dynamic view of how your audience interacts with your content the moment you publish it.
How to Access Live Customer Activity
Finding this report couldn’t be simpler.
In your GA4 dashboard, navigate to “Reports” > “Realtime”. You’ll immediately see an interactive dashboard showing active users, their geographic locations, and the pages they’re currently viewing.
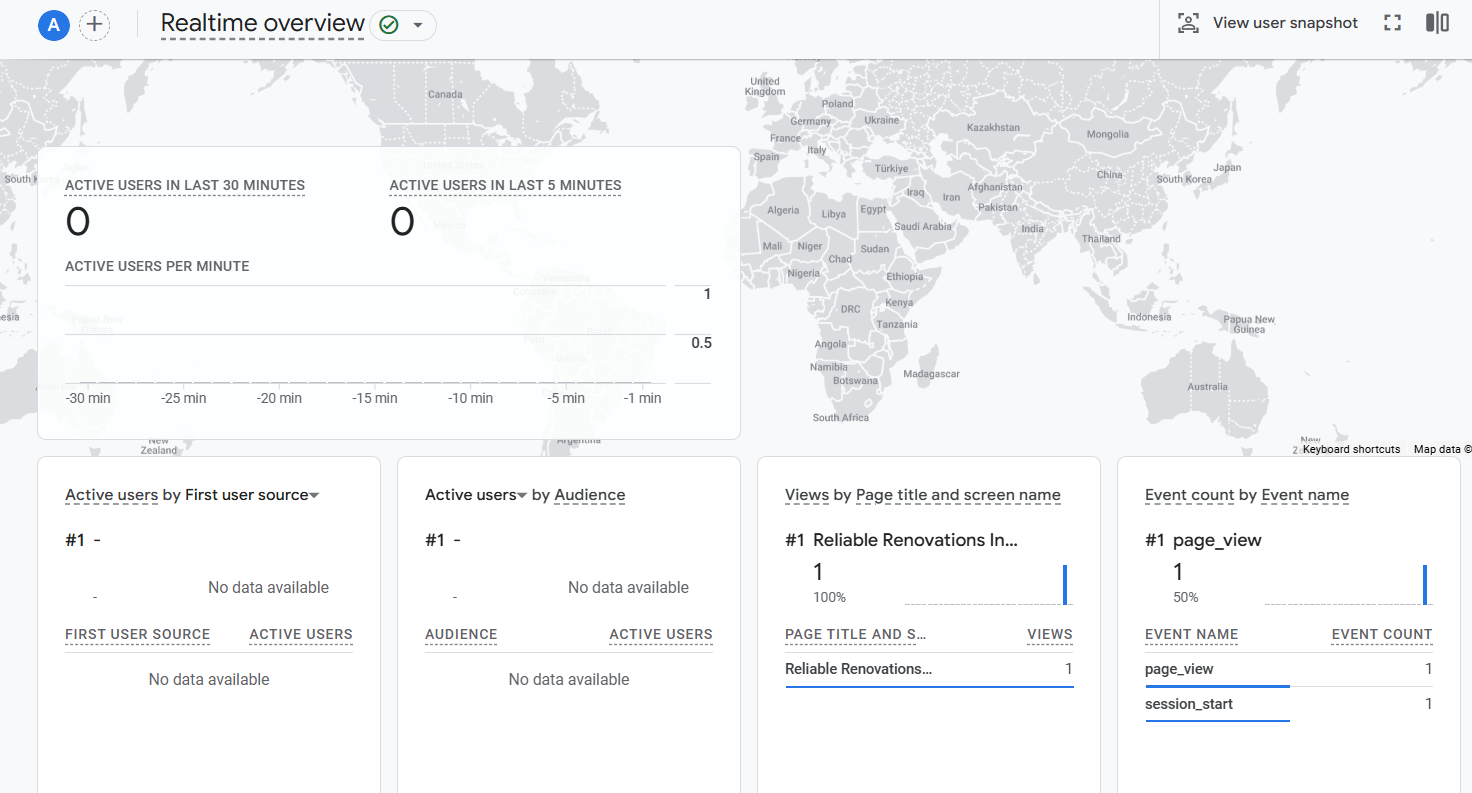
The data updates continuously, giving you a minute-by-minute pulse on your website’s activity.
This is particularly valuable when you’ve just launched a new campaign or published fresh content and want to gauge its immediate impact.
Practical Uses for Immediate Business Insights
While this report isn’t for long-term strategic decisions, it serves several powerful purposes for business owners.
First, it’s perfect for verifying that your tracking codes are working correctly after making website changes.
Second, it lets you monitor the immediate impact of your marketing efforts – you can literally watch visitors arrive after sending a newsletter or posting on social media.
For example, if you’re a Cape Town restaurant that just posted a new special on Instagram, you can watch as users view your menu page in real-time.
Turning Live Data into Quick Actions
The true value for South African SMEs comes from using these immediate insights to make quick, informed decisions.
If you notice a particular page is getting unexpected live traffic, you might choose to highlight that content more prominently.
If you see users from a specific location engaging with your site, you could quickly craft a geo-targeted social media post to capitalize on that interest.
While the Realtime report shows you a snapshot in time, it helps you understand user behaviour patterns and validate that your marketing activities are generating the immediate attention you intended.
Conclusion
You now have a powerful starting point.
By focusing on these five core reports in Google Analytics 4, you’ve cut through the complexity and can start making sense of the data that truly matters for your South African SME.
Remember, the goal isn’t to become a data expert overnight, but to build a consistent habit of checking these insights.
Spend just ten minutes each week reviewing your traffic sources, top pages, and conversions.
This simple routine will transform how you see your website—from a static online brochure into a dynamic, profit-driving engine.
You’ll stop guessing about your marketing and start making confident, data-informed decisions that protect your budget and fuel your growth.
Ready to stop guessing and start growing? Book your free, no-obligation GA4 Health Check with our team today.
We’ll help you set up these vital reports and find one immediate insight you can use.